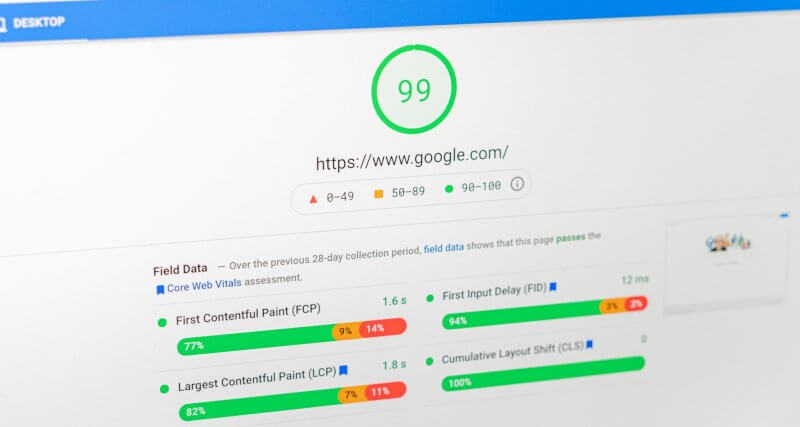
Learn about Core Web Vitals, the metrics that measure user experience and loading performance of web pages.
Much has been said about Core Web Vitals since the Page Experience Update when Google announced that some performance metrics would become part of the search results ranking system.
Not without reason, the SEO community went into an uproar. However, before going around applying a thousand optimizations, it is necessary to learn what the main web metrics are in depth.
And even more important than that: understanding how much they really influence page rankings.
To help you with this, I brought up some very important topics in this post:
What are Core Web Vitals?
The Core Web Vitals measure the user experience and loading performance of a web page.
LCP (Largest Contentful Paint)
LCP is the metric that most faithfully represents loading speed. It measures the elapsed time between the start of page loading and the rendering of the largest element of the first fold.
In the example, the LCP is the text highlighted in green, as it is the singular element that occupies the largest area of the screen.
Also shown in the image, FCP (First Contentful Paint) is another performance metric that is not part of Core Web Vitals. It measures the elapsed time between the start of page loading and the rendering of the first visible element.
FID (First Input Delay)
FID is the metric that measures the elapsed time between the user's interaction with a page element and the browser's response.
You know when you click on a button as soon as the page has started to load, and the browser seems to take a long time to respond to the request? So, that's it right there.
CLS (Cumulative Layout Shift)
CLS is the metric that measures unexpected layout changes that detract from the user's experience when interacting with the page.
That is, it's when you try to click a button and, at the last minute, the page elements shift, causing you to click in the wrong place.
Often, it can lead the user to perform an action he didn't want, as in the example.
Field and Lab Data: What's the Difference?
On your journey of studying Core Web Vitals, you will probably hear about field and lab data. But what is the difference between them?
And which of the two is better? None. You need to evaluate the set to get a complete picture of your pages.
Field data bring real data but represent only a small portion of the users who accessed your site. After all, they need to use Chrome and grant permission for Google to use the data to feed the reports.
However, they are useful for understanding how your site's pages perform in practice under varying conditions of devices or network connections, for example.
In turn, laboratory data brings information about a given simulation in real-time when you use the tool.
Although it doesn't represent the real picture of users, this data is useful for identifying performance issues that are independent of specific platforms.
How to measure the performance of my pages?
There are three Google tools that allow you to measure Core Web Vitals:
Google PageSpeed Insights
Google PageSpeed Insights is a tool that brings specific and in-depth data on the loading performance of web pages.
Furthermore, in the case of field data, there are indications about the environment and conditions under which the information was collected.
Except for the FID (see why in the Google Lighthouse thread), PageSpeed Insights also features the measurement of Core Web Vitals in a lab environment.
That is, it is possible to compare the results to identify disparities and have a complete view of the performance of the page.
Google Lighthouse
Google Lighthouse is an open-source tool that brings performance, accessibility and SEO data about web pages. You can run it in two ways:
In Lighthouse, Core Web Vitals are in the Performance section at the top of the results page.
The only missing metric is the FID. It does not appear because Lighthouse is made up of laboratory data, and it is necessary to measure the experience of real users in order to have a concrete picture of the FID.
In this case, the tool uses TBT (Total Blocking Time) as an alternative to predict bottlenecks in the FID.
This metric represents the amount of time that tasks longer than 50ms block the main thread from instantly responding to user interactions.
Google Search Console
Alongside the announcement of the Page Experience Update, Google launched a new Search Console section.
The page experience report brings real usage data from the last 90 days regarding Core Web Vitals, mobile friendliness and HTTPS protocol. It is located under the "Experience" tab in the Search Console sidebar.
So far, the report only shows data collected on mobile devices, which makes sense, as Google prioritizes the mobile version of pages for crawling and indexing.
Within the Core Web Vitals report, you will find:
Overview of the Core Web Vitals performance of the website URLs, according to the classification "bad", "improvements needed", and "good".
A detailed listing of the performance of the site's URLs, also broken down by the Core Web Vitals quality ranking, with an indication of trends over time.
Listing of URLs affected by issues with each of the Core Web Vitals, with a grouping of pages similar in content and features.
Button to validate the correction of problems and speed up Google tracking.
